


What Is Machine Learning (ML)?
Deep Learning vs. Machine Learning
In the past few years, ML has gone from a discipline reserved for expert data scientists and engineers to the mainstream of business and analytics professionals. With advancements in automated ML (AutoML) and collaborative AI and ML platforms (like Dataiku), the use of data — including for predictive modeling — across people of all different job types is on the rise. By definition, ML means teaching a machine to learn from experience without explicitly programming rules that dictate how to perform a specific task.
Deep learning is a subset of ML. In a nutshell, deep learning is a powerful technique that utilizes many stacked layers of neural networks and is extremely powerful for use cases that involve unstructured data such as images, text, sound, and time-based information.

Machine Learning Model, Machine Learning Algorithm… What’s the Difference?
When reading about ML, you have probably seen the expressions “ML model” and “ML algorithm” used quasi-interchangeably, which can lead to some confusion.
Put simply, the relationship between a model and algorithm is as follows:
- An algorithm is the specific method a computer uses to process data in order to make predictions or find patterns.
- A model is the output produced by an algorithm after it has been trained on data. It represents the learned patterns and a repeatable way to make predictions on or understand new, unseen data.
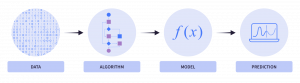
An ML model will take your data as input, apply the rules of the algorithm(s) used, and produce an output model as result.
For example, algorithms include linear regression, decision trees, k-means clustering, and neural networks. Each of these algorithms has a specific way of processing data to make predictions or find patterns.
What Are Machine Learning Algorithms?
We hear — and talk — a lot about algorithms, but the definition is sometimes a bit of a blur. An algorithm is actually just a set of rules used to solve a problem. If you’ve ever taken a simple BuzzFeed quiz to answer important questions in your life, like what “Sound of Music” character matches your personality — you may notice that it’s really just asking a series of questions and using some set logic to generate an answer. Let’s explore the key categories of supervised learning algorithms.
Many of the most popular supervised learning algorithms fall into three key categories:
- Linear models, which use a simple formula to find a best-fit line through a set of data points.
- Tree-based models, which use a series of “if-then” rules to generate predictions from one or more decision trees, similar to the BuzzFeed quiz example.
- Artificial neural networks, which are modeled after the way that neurons interact in the human brain to interpret information and solve problems. This family of model architectures forms the basis of deep learning.
ML is really all about using past data to either make predictions or understand general groupings in your dataset. Linear models tend to be the simplest class of algorithms, and work by generating a line of best fit. They’re not always as accurate as newer algorithm classes, but are still used quite a bit, mostly because they’re fast to train and fairly straightforward to interpret.
Supervised vs. Unsupervised ML
ML can be divided into two key subcategories:
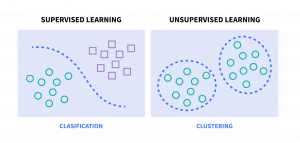
- Supervised ML, where the algorithm is given labeled data to train on, which helps it learn the underlying patterns and relationships between the inputs and desired output.
- Unsupervised ML, which infers patterns from an unlabeled dataset. Here, you aren’t trying to predict a known outcome, you’re just trying to understand patterns and groupings in the data.
What Is Supervised Machine Learning?
Supervised learning is like having a personal teacher to guide you through the learning process. In supervised learning, the algorithm is given labeled training data that acts as a teacher, providing the algorithm with examples of what the correct output should be.
Supervised learning is typically used when the goal is to make accurate predictions on new, unseen data.
Types of Supervised ML
Supervised learning can be further split into regression (predicting numerical values) and classification (predicting categorical values). Some algorithms can only be used for regression, others only for classification, and many for both.

Classification: Classification is a type of supervised ML where the goal is to predict which categories or classes new data falls into based on predefined categories or classes.
Regression: In regression, a model provides a continuous output variable based on one or more input variables. The model learns to predict a numerical value, such as price or temperature.
Supervised ML Use Cases
Predictive analytics is one of the most common use cases for supervised ML. It involves using historical data to predict future events such as stock prices, sales trends, or customer behavior.
Time series forecasting is used to predict future values of a time series based on its past values. For example, to estimate future values in stock prices, revenue predictions, or weather patterns.
What Is Unsupervised Machine Learning?
Unsupervised learning is like a treasure hunt — you’re given a map, but it’s up to you to figure out where the treasure is. Unsupervised learning is typically used when the goal is to identify patterns and relationships in data. This method is used when working with large datasets where labeling the data may be time-consuming or impractical, or where discovery or data understanding is the primary goal.
Types of Unsupervised ML
There are several methods of unsupervised learning, but clustering is far and away the most commonly used unsupervised learning technique. Clustering refers to the process of automatically grouping together data points with similar characteristics and assigning them to “clusters.”
Unsupervised ML Use Cases
Some use cases for unsupervised learning — more specifically, clustering — include:
- Customer segmentation, or identifying different customer groups with distinct characteristics around which to build marketing or other business strategies.
- Topic modeling, to discover themes and topics present in unstructured text documents or collections.
- Genetics, for example clustering DNA patterns to analyze evolutionary biology.
- Recommender systems, which involve grouping together users with similar viewing patterns in order to recommend similar content.
- Anomaly detection, including fraud detection or detecting defective mechanical parts (i.e., predictive maintenance).
How Does Machine Learning Work?
The practical purpose of ML is to create a mathematical model that accurately and reliably represents a given decision-making process.
By generating a model, we can complete that task over and over on new, unseen data without having to build the task from scratch. This allows us to automate and scale time-consuming or complex processes.
In short, an ML model is trained to recognize specific patterns in a dataset and then used with new data to identify similar patterns and/or make predictions for analysis. The ML model acts as a blueprint for future analysis tasks using ML.
Types of Machine Learning Models
Prediction
Predictive modeling is about making predictions about future or unknown data. The nature of the target variable will drive the kind of prediction task.
For example, let’s say we want to build a prediction model with the goal of predicting whether or not a patient will be readmitted to the hospital within a specific time span. We can train the model using historical data with the prediction target selected “hospital readmission.” During the training cycle, the model will identify the variables which serve as the strongest predictors of our prediction target. At the end of training, the ML model can be deployed into our data analysis workflow. This model can then be used to predict what patients are likely to be admitted again in the future.
Clustering
Clustering refers to unsupervised learning problems where the target is unknown, and you’re looking to find patterns and similarities in your data points. Clustering models are inferring a function to describe hidden structure from “unlabeled” data. These unsupervised learning algorithms are grouping similar rows given their features.
Using the same hospital example, we might want to see if there are distinct groupings of patient types that are readmitted to the hospital, or identify readmission anomalies. We could use a clustering model for these types of use cases.
What Is a Machine Learning Lifecycle?
For those familiar with a formal software development lifecycle, it won’t come as any surprise that ML models have a lifecycle too. The typical ML model lifecycle can be summarized in a four steps:
- A model is born through the data science process. This begins with data access and preparation (including feature engineering), and then involves the design, training, exploration, and selection of the best model.
- The model is deployed to production (which is like making it to the big time in the model world).
- The model is maintained over time with multiple retraining updates.
- Finally, the model is retired or replaced with a better one. Typically, this would be a newer, better model, maybe based on a new technique or new data that was unavailable previously.
Step 1: Design, Train, and Explore:
As previously mentioned, ML models are typically used for prediction or clustering. In prediction, we are looking to predict a calculable outcome. In clustering, we are trying to identify patterns, relationships, or data insights.
To use a machine learning prediction model, the raw data must be cleaned and prepared just as it would be for other data analytics tasks. The machine learning technique is selected and then the model can be trained. An ML model is trained to identify the specific patterns using a reference set of data. This training results in an ML model that can be used on future datasets to identify similar patterns and make predictions.
Hyperparameters are settings or configurations that define the behavior and performance of ML algorithms. Unlike parameters, which are learned from the data during the training process, hyperparameters are set before training and remain fixed during the model fitting. They control aspects of the training process and the structure of the model. The process of searching for the combination of hyperparameters that yields the best model performance is called hyperparameter optimization (HPO).
There are various approaches to HPO; the most exhaustive version being “grid search,” which is a brute force, recursive comparison of all possible hyperparameter combinations to see which maximizes your desired optimization metric. In other words, try everything and then decide what worked best. This approach ensures no stone is left unturned in the search for the best settings, but comes at a cost of computational resources and time. Often ML models can be trained much more efficiently using specialized HPO techniques such as random search, Baysian optimization, and genetic algorithms.
Data scientists iteratively train and compare many models, and tweaking the input features and handling techniques, ML algorithms, hyperparameters, etc. until a model is identified that meets the desired goals for performance and credibility. Thoughtful and disciplined model experimentation and comparisons model development steps are essential to producing high quality, trustworthy models.
Step 2: Deployment
In this step, the selected model is deployed to production. This process typically involves readiness steps to first stress-test the model, analyze it for fairness and potential bias, and gain the appropriate approvals. During this phase, the model is deployed to a QA or production environment and connected to production data sources (versus ad hoc data warehouses or storage used in sandbox environments for prototyping and development). Machine learning engineers will also set up the feedback loop required to monitor the model over time to detect drift or declining performance in production.
Step 3: Retraining
Predictive models will need retraining when the data or conditions in the real world differ from what the model was trained on. This data drift happens over time and can impact predictions’ accuracy, resulting in the need to retrain the model on newer data. A good model workflow will support retraining without having to start over with a model from scratch, saving a lot of time as this means teams will not need to re-do the often time-intensive pre-work of data sourcing, preparation, and feature engineering.
Top 3 Change Management Considerations in ML Deployment
Unfortunately, a significant percentage of data science projects never actually make it out of the lab and to the finish line of the machine learning pipeline. Here are two key reasons behind data science projects never being operationalized:
1. Not Starting With a Business Objective From the Beginning
Many times, organizations jump into using AI and machine learning (such as in a new part of the organization that isn’t currently using the technology for any of its operations) and aren’t sure exactly how it can provide impact or value. For example, a team may have heard that building out a churn prediction model could prove fruitful, but they didn’t define the goals, business problems the model will help solve, or how to use the model in production. Data scientists and anyone working directly with ML models should always make sure there’s no disconnect between building the model and actually doing something with it.
2. IT Design and Productionalization Gap
IT teams often take projects that they then have to adapt to a new programming language, harden, and re-code for production systems. This delay and rewrite process is often where data science projects die or become irrelevant in the time it takes to launch.
Change Management in Machine Learning Deployment
1. Data Scientists Like to do Their Own Things and Enjoy Full Control
When working on their own laptop, data scientists can install whatever packages they want, know how they’re setting up their virtual environments, are in control and can easily see everything, and more. Often, though, they need to collaborate with other people and that’s where collaborative data science platforms come into play. By making use of version control technology or working on a shared cloud server, teams can collaborate with colleagues and avoid silos and duplicate work.
2. People Don’t Always Trust the Model or the Underlying Technology
Model development is in fact an iterative process — there should be feedback loops where the business side is sharing and monitoring things in terms of effectiveness and communicating that back to the data science team to react and change features, use different training data, and so on. If the stakeholders on the business side aren’t involved in assessing the real-world utility of the model, this can likely lead to problems down the road. In general, it’s important to use technology to augment (not replace) the work done by humans, who are kept in the loop for reality checks and human judgment on elements of accuracy and fairness.
3. IT Translating Models Into Traditional Languages/Platforms Like Java
With tools like Dataiku, pipelines and models can be seamlessly deployed into production environments. With packaged code environments, versioning, and data source remapping for streamlined deployments, IT teams no longer need months to recode or refactor entire workflows and models from data science languages like Python into IT languages like Java.
Tooling Issues With Machine Learning Deployment
If data scientists have a disparate combination and/or inconsistent usage of data science tools, including machine learning data labeling tools for example, chances are the data workflow — including ML deployment — will be anything but seamless. By allowing everything data-related to happen in one single tool (such as Dataiku), teams will have more transparency into how the data was cleaned and modeled, version control and rollback capabilities, and collaboration.
Building a Predictive Machine Learning Model With AutoML
AutoML is a tool that automates the process of applying ML and can make quick, baseline modeling simple. Although AutoML often comes wrapped in a visual, point-and-click interface suitable for novices, even experienced data scientists can use AutoML to accelerate their work.
For example, in Dataiku, users can select between the AutoML mode where the tool makes a lot of optimized choices for you and the Expert Mode where you can code a custom estimator or deep learning architecture. Note that even when using AutoML, you’ll still be able to modify all model settings and hyperparameters, including which types of algorithms to try, choosing between fast prototypes, interpretable models, or high performing models with less interpretability.
Data Access, Exploration, and Prep
Getting the Data
Mixing, merging, and collecting data from many different data sources can take a data project to the next level. There are a few ways to get usable data:
- Connect to a database: Ask data or IT teams for access to the data that’s available.
- Use APIs: Application Programming Interfaces (APIs) allow two applications to talk to each other, and they can be used to access data from tools like Salesforce, and a host of other applications on the web or that your organization might be using. If you’re not an expert coder, Dataiku plugins provide lots of possibilities to bring in external data.
- Look for open data: The web is full of datasets to enrich what you already have with additional information. For example, census data could help add average revenue for the district where a user lives, or OpenStreetMap can provide the number of coffee shops on a given street. A lot of countries have open data platforms (like data.gov in the United States).
Preparing the Data
Preparing data for ML can take up to 80% of the time of an entire data project. In other words, making sure data is consistent, clean, and usable overall is no small undertaking. However, having clean data is critical when building machine learning models — garbage in, garbage out, as the saying goes.
Analyzing, Exploring, and Cleaning the Data
Before building a model, it is good practice to carefully understand the dataset(s) at hand. Spending time properly analyzing, exploring, and cleaning data at this stage not only can ensure better results, but it also helps avoid serious issues (e.g., using inherently biased or problematic data that can easily lead to biased or otherwise problematic models).
Start digging to see what data you’re dealing with and ask questions to business people, the IT team, or other groups to understand what all variables mean. Good data stewardship (tags, descriptions, robust table metadata), cataloging, and hygiene can help scale and accelerate some of this research. From there, you’ve probably noticed that even though you have a country feature, for instance, you’ve got different spellings, or even missing data. It’s time to look at every one of your columns to make sure the data is homogeneous and clean.
Keep an eye out for data quality issues, such as missing values or inconsistent data — too many missing or invalid values mean that those variables won’t have any predictive power for your model. Plus, many machine learning algorithms are not able to handle rows with missing data. Depending on the use case, we could impute (or assign) the missing values with a constant, like zero, or with the median or mean of the column. In other cases, we might choose to drop rows with missing values entirely.
Model Design
Feature Selection
After exploring and cleaning datasets, the next step is selecting the features you’ll use to train your model. Also known as an independent variable or a predictor variable, a feature is an observable quantity, recorded and used by a prediction model — in structured datasets, features appear as columns.
The main reasons behind using feature selection are that it:
- Reduces complexity. Including only the most relevant features means less complexity, which is good not only for model explainability, but also for training speed. Less complexity can also mean better accuracy, as irrelevant features introduce noise.
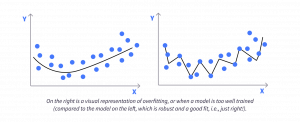
- Reduces overfitting. Overfitting is when a model has learned too much detail or noise in the training data that won’t necessarily exist in unseen data. In this case, the model will appear to perform well on the training data but will perform poorly on unseen data. This is often referred to as the model not generalizing well.
Some features can negatively impact model performance, so you’ll want to identify and remove them. Common feature selection methods include:
1. Statistical tests, which can be used to select those features that have the strongest relationship with the output variable. For example, univariate analysis is useful for exploring a dataset one variable at a time. This kind of analysis does not consider relationships between two or more variables in your dataset. Rather, the goal here is to describe and summarize the dataset using a single variable. On the other hand, bivariate or multivariate analysis is useful for analyzing two or more variables to determine the relationships between them.
2. Correlation matrices are useful for showing the correlation coefficients (or degree of relationship) between numeric variables. Correlation states how the features are related to each other or the target variable. Correlation can be positive (increase in one value of feature increases the value of the target variable) or negative (increase in one value of feature decreases the value of the target variable). Correlation matrices allow you to view a visual table of the pairwise correlations for multiple variables in your dataset and are often visualized as heatmaps, which makes it easy to identify which features are most related to the target variable. If two or more input features are highly correlated with each other (an occurrence known as collinearity or multicollinearity), you may want to consider removing features that contain redundant information as this will simplify the model, improve interpretability, and reduce the risk of overfitting.
Feature Handling and Engineering
Feature handling is about making certain transformations to features that would allow them to be better used and positively impact the performance of your model. Assuming that you have clean data, feature handling and engineering is where you can make the biggest impact when creating an ML model — so it’s pretty important!
A feature’s variable type determines the feature handling options during machine learning:
- Numerical variables take values that can be added, subtracted, multiplied, etc. There are times when a variable’s values look numerical, but those values actually represent categories, or “classes”. For instance, if you have a “product type” feature with two values: “1” and “2,” rather than handling this as a numeric feature, it is more accurate to treat it as a categorical feature..
- Categorical variables have a fixed, limited number of possible values, each representing a distinct category, group, or label. They often describe characteristics of attributes that don’t have a natural numeric ordering, like gender, color, or country. Because ML algorithms require features to be numeric, categorical feature handling techniques encode these variables in various ways to preserve the information, but in numeric format.
- Text variables are arbitrary blocks of text. If a text variable takes a limited number of known values (for instance, “white T-shirt M,” “black T-shirt S,” etc.), it may be useful to treat it as categorical.
Feature engineering relates to building new features from the existing dataset or transforming existing features into more meaningful representations — take, for example, raw dates. Raw dates are not well understood by machine learning models, so a good strategy would be to parse those dates, or convert them into numerical features to preserve their ordinal relationship.
Another example of when feature engineering might be necessary is if there are large absolute differences between values — in this case, we might want to apply a rescaling technique. Feature scaling is a method used to normalize the range between the values of numerical features. Why? Because variables that are measured at different scales do not contribute equally to the model fitting, and they might end up creating a bias.
Note that some data science, machine learning, and AI platforms (like Dataiku) automatically add normalization, though it’s still important to understand the basics of what’s happening. For example, one of the most common rescaling methods is min-max rescaling (also known as min-max scaling or min-max normalization), which is the simplest method. It consists of scaling the data to a fixed range — usually 0 to 1. Having this bounded range means smaller standard deviations, which can suppress the effect of outliers.
Featuring engineering looks a little different for categorical variables — for example, one transformation involves encoding categorical variables as numbers so that they can be understood by the machine learning algorithm. Dummy-encoding (vectorization) creates a vector of 0/1 flags of length equal to the number of categories in the categorical variable.
Training on a Subset of the Data
When developing an ML model, it is important to be able to evaluate how well it can map inputs to outputs and make accurate predictions. However, if you use data that the model has already seen (during training for example) to evaluate the performance, then you will not be able to detect problems like overfitting.
It is a standard in ML to either first split your training data into a set for training and a set for testing or split your data three-fold into training, evaluation, and testing sets. There is no rule as to the exact size split to make, but it is sensible to reserve a larger sample for training — a typical train/test split is 80%/ 20%. Most of the time, the data is randomly split so that you are getting a good representation of the patterns that exist in the data in both sets. However, in certain cases, such as when you’re predicting rare events (like fraud) or when all outcome classes are not equally likely to occur in the training data, it is best practice to overweight the event in training samples or use a stratified sample to ensure all possible output classes have enough representation in the training data to ensure proper learning and prevent bias.
Defining the Model Task
With Dataiku AutoML, you’ll still need to make a few decisions when creating your model (even for fast prototypes):
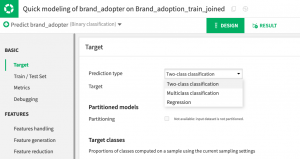
1. Select a target variable. Since we are going with a supervised learning model, we need to specify the target variable, or the variable whose values are to be predicted by our model using the other variables. In other words, it’s what we want to predict.
 2. Confirm the prediction type. After identifying the target variable, AutoML automatically detects the expected prediction type (though you can modify the default selection). As a reminder, the main types of prediction are:
- Regression, or predicting a numerical value.
- Classification, meaning predicting a “class,” or an outcome, between several possible options.
Selecting the Algorithm and Hyperparameters
Different algorithms have different strengths and weaknesses, so deciding which one to use for a model depends largely on your business goals and priorities.
It’s also important to understand the concept of libraries, which are sets of routines and functions that are written in a given language, making it easier to perform complex ML tasks without rewriting many lines of code. For example, Dataiku AutoML comes with support for four different ML engines:
- In-memory Python (Scikit-learn / XGBoost)
- MLLib (Spark) engine
Beyond choosing an algorithm, one other aspect of building an ML model is tuning hyperparameters. Hyperparameters are parameters whose values are used to control the learning process — think of them as the settings of the ML model. They matter because they control the overall behavior of an ML model, and tuning or optimizing hyperparameters can help your model perform better. For a baseline model, AutoML helps by quickly honing in on the most promising potential hyperparameter optimizations, and therefore can help you build better models in a limited amount of time.
Model Evaluation
How do you know if your model is any good? That’s where tracking and comparing model performance across different algorithms comes in.
Metrics Evaluation and Optimization
There are several metrics for evaluating ML models depending on whether you are working with a regression model or a classification model. It’s also worth noting that for most algorithms, you’ll also choose a specific metric to optimize for during the model training. However, that metric might not be as interpretable as some of the other evaluation metrics for actually determining how well a model works.
For regression models, you want to look at mean squared error and R-squared (R2). For classification models, the most simple metric for evaluating a model is the F1 score. Accuracy is a common word, but in this case we have a very specific way of calculating it. Accuracy is the percentage of observations that were correctly predicted by the model. Accuracy is simple to understand but should be interpreted with caution, in particular when the various classes to predict are unbalanced.
Overfitting and Regularization
We’ve mentioned overfitting in some of the previous sections, but at this point, it’s worth coming back to it in more detail as it can be one of the biggest challenges to building a predictive model. In a nutshell, when you train your model using the training set, the model learns the underlying patterns in that training set in order to make predictions.
But the model also learns peculiarities of that data that don’t have any predictive value. And when those peculiarities start to influence the prediction, we’ll do such a good job at explaining our training set that the performance on the test set (and on any new data, for that matter) will suffer. One remedy for overfitting is called regularization, which is basically just the process of simplifying your model or making it less specialized.
Through feature engineering, AutoML applies handling strategies for feature selection and reduction, missing values, variable encoding, and rescaling based on data type. Because of its algorithm-agnostic approach, you’ll always have access to the best services and models, allowing you to make model tradeoff decisions based on performance, cost, and complexity factors.
Optimize Your Processes for Scale With ML
Machine learning capabilities add real value to organizations looking to improve their processes and understand complex external factors that impact growth. ML models and the machine learning model lifecycle can drastically reduce the labor of data analysis and data research by automating a key element of creating business outcome predictors.